The Beauty of Infographics
a powerful way for student to make their learning visible

When I was a child I loved stumbling across a detailed infographic in a book. I remember browsing through encyclopedias—too young to have the patience for dense text—skimming instead through the illustrations. I loved finding the pages in the World Book on acetate. Turning those transparent pages revealed deeper layers of the illustration—for example, the human body—moving from skin, to muscle, to organ, to bone.
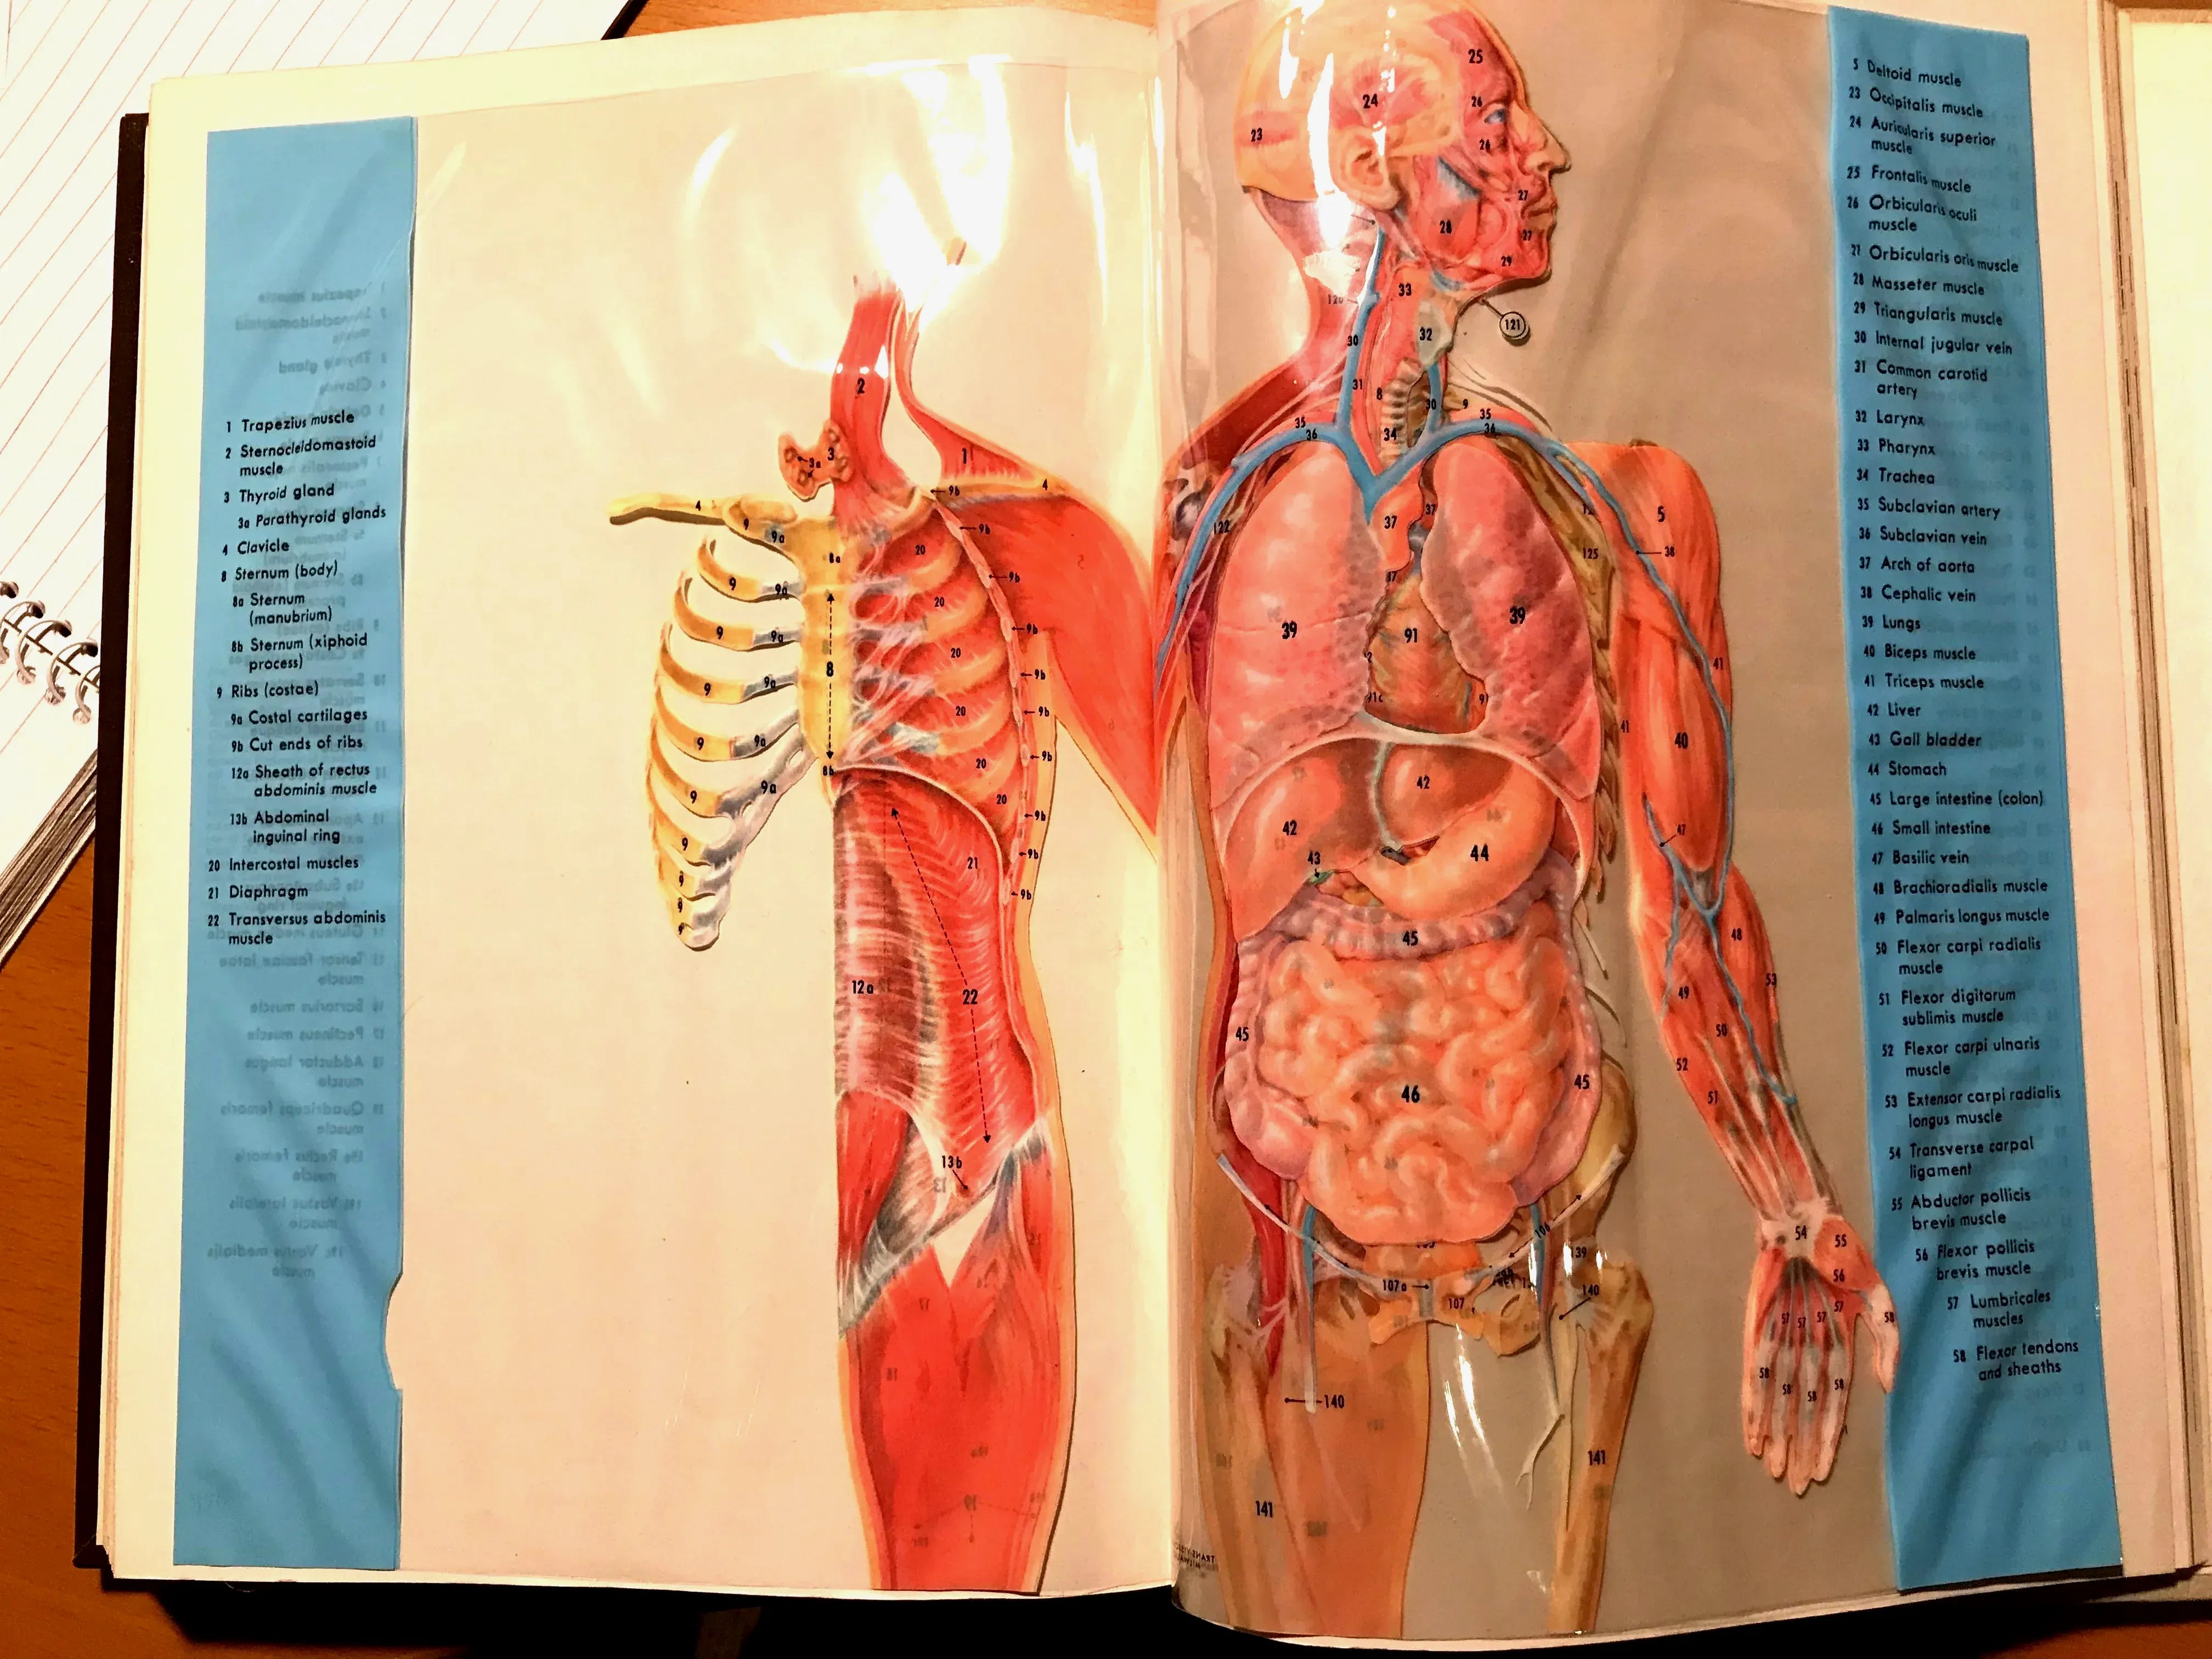
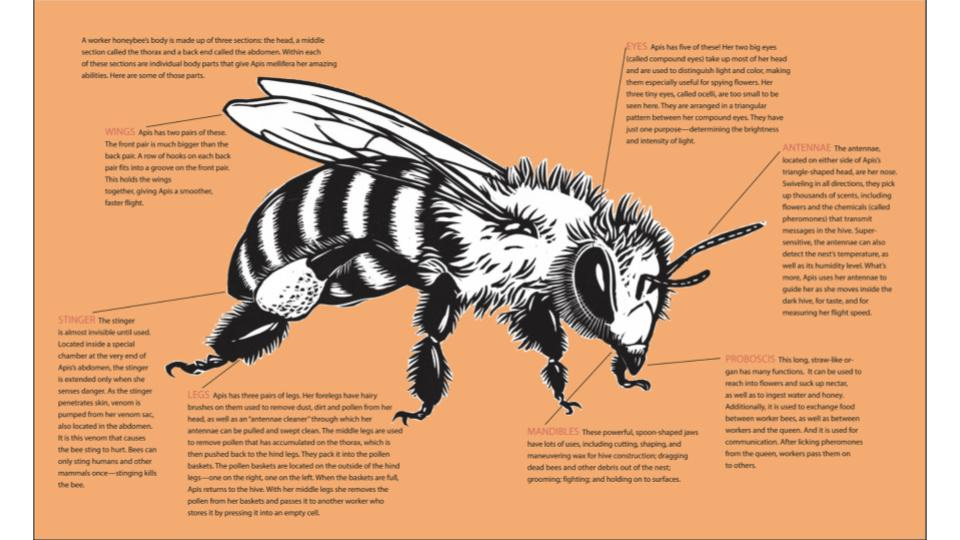
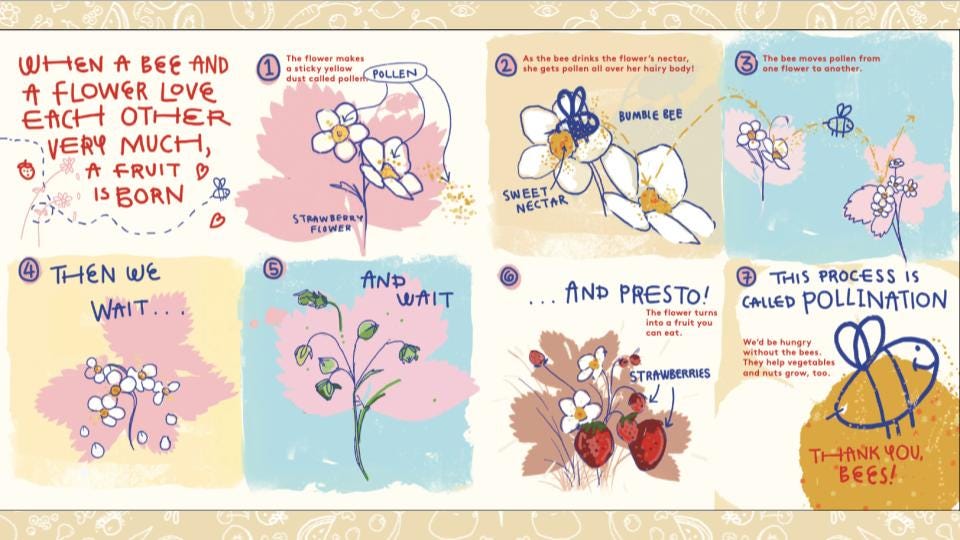
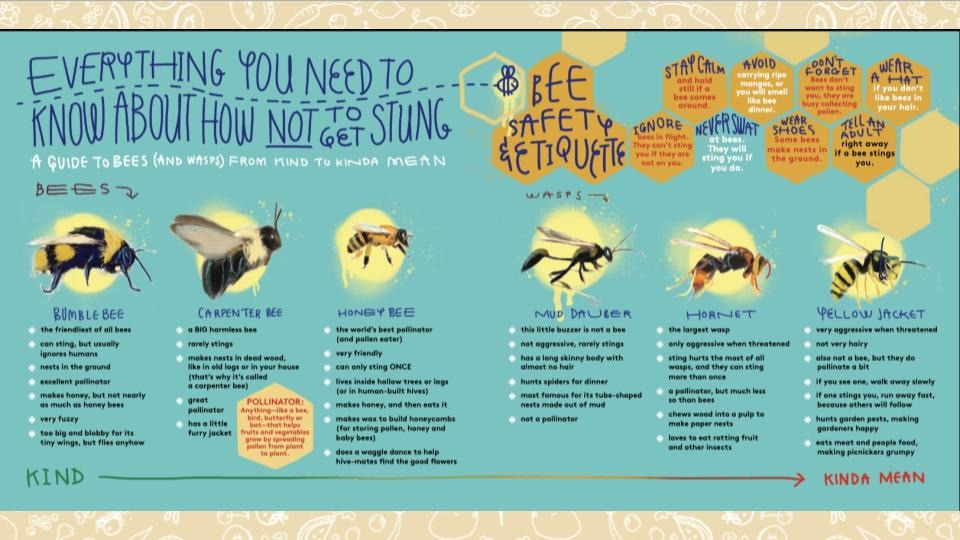
That fascination for infographics has stayed with me. When we began researching children’s books on bees for our Chicago Teacher Summer Institute, I noticed how many of them included infographics at the beginning or the end. Each served a different purpose: illustrating a bee’s anatomy, the pollination journey from hive to flower and back again, and the life cycle of the bee.
Infographics convey information through both text and image. With this in mind, I began thinking about how we often teach and test students on factual knowledge. Despite research showing that projects and portfolios are stronger measures of student learning, assessment still largely relies on text-based tests. An Educational Testing Service study found that 97% of Science teachers assess through testing once-a-month (and 77% give multiple-choice tests).
This led us to frame our institute with two key questions:
How do we learn?
How do we demonstrate our learning?
In my last post I discussed how we used an inquiry approach to study the life cycle of bees. To do this, we introduced a constellation of artifacts: video, texts, illustration, and real-life experiences. Teachers watched an episode of Our Planet, read Honeybee, and visited an apiary. Throughout the process, we asked them to notice their own learning: What worked? What didn’t? For some, seeing bees up close and talking with an expert was essential. Others absorbed more from a structured text. This reinforced the idea that people learn in different ways.
Personally, I’m a board gamer. I love reading forty-page rulebooks and then jumping into a game. But many of my friends prefer learning the rules on YouTube, watching a full play-through of a game, or simply learning by doing. The classroom is no different—it requires a constellation of entry points so every student can engage with complex content in a way that works for them.
After these shared experiences we asked teachers to demonstrate their learning in the form of an infographic. Artist, educator, and designer Tommaso Iskra de Silvestri researched and assembled examples of infographics from across history and cultures. When we introduce an arts-integrated project, we always show professional models from the real world. This avoids “arts and crafts” activities (think hand turkeys or cotton-ball Santas) and grounds learning in authentic artistic traditions.


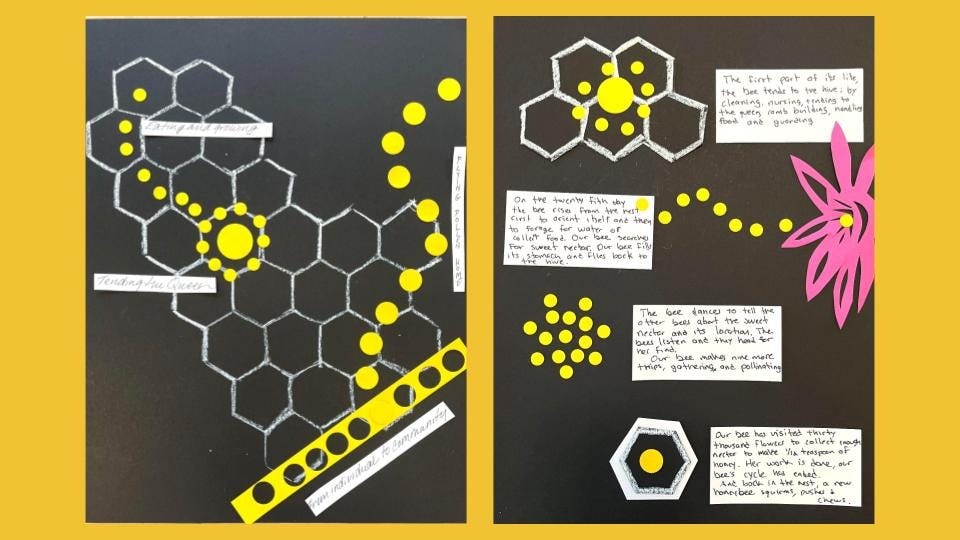
For the project, participants highlighted four important aspects of a bee’s life cycle and represented them visually. Visual Arts Educator Cynthia Weiss often reminds us that the final result of any arts project should be beautiful—both individually (every student experiences success) and collectively (the class creates something meaningful together). One of her core techniques is limiting the palette: restricting color, material, or form to encourage focus and cohesion. So we didn’t hand participants blank paper and pens with vague instructions to “make an infographic.” Instead, we offered specific colors of paper—mainly white, black, and yellow—and asked that bees be represented as yellow circles. Of course, we still said “yes” whenever someone wanted to break the rules.


At home, my kids often complain that “they didn’t learn anything in school today.” By “learning,” they usually mean the skills and content at the heart of different subjects. The problem isn’t the content itself, but how it’s taught and tested. When we ask, “How do we learn?” and “How might we represent our learning?” we open the door to alternatives to textbooks and testing—alternatives that are rigorous, creative, and beautiful.
Special thanks to Tommaso Iskra de Silvestri, Cynthia Weiss, and Fannie Medina for co-designing and teaching this infographic project.
Love this, Kurt! I’m going to riff on your ideas with my teacher prep students this semester and next. You know I’m not a textbook and testing instructor! I’ve been wanting to incorporate board games…infographics, too, but haven’t made it happen yet. I’m so glad I stumbled on your Substack!
I agree learning has to be beautiful too, and there are so many ways to demostrare what we have learned. My love for reading didn’t come from a teacher giving me a book to read along with comprehension questions to answer. It came from Ms Paty first telling us stories from the Odyssey, the entire class gather around a circle. Those are still memories I hold close to my heart.